
From 4.11.16 – 4.14.16 an IVR based poll was conducted in New York of likely Republican presidential primary voters. The poll was has an N = 14,201(!), weighted, stratified listed sample at the statewide level and each individual congressional district. Yes, each congressional district. Delegate math junkies here is your fix.
Results of the New York Survey can be found at http://bit.ly/NYpoll041116-041416
Full deep dive analysis of results can be found in these follow-up pieces:
Trump Ahead but New York Winner Take All Uncertain
What are Trump’s Chances in the New York General Election?
Trump has Moved his Tribe Against a Conservative Star
In the interest of transparency, the following paragraphs will provide the standard information made available by most reputable polls as well as explain the thought process behind our methodology. We hope this serves to raise the bar on what should be disclosed on polling methodology.
SAMPLING METHODOLOGY & UNIVERSE DEFINITION
Since we are interested in assessing attitudes of potential voters, our population is all those who will vote in New York’s 2016 Republican Presidential primary election. Considering the obvious issues of not knowing who will participate in the upcoming Republican primary, we start with a sampling frame of all registered voters based on in-house voter files maintained by 0ptimus. This sampling frame is deemed to be too large because historically the proportion of registered voters who vote in the Presidential primary is quite small. For example, of the over 2,200,000 currently-registered New York Republicans in our voter file, roughly 150,000 (6.8%) voted in the 2012 New York Republican Presidential primary.
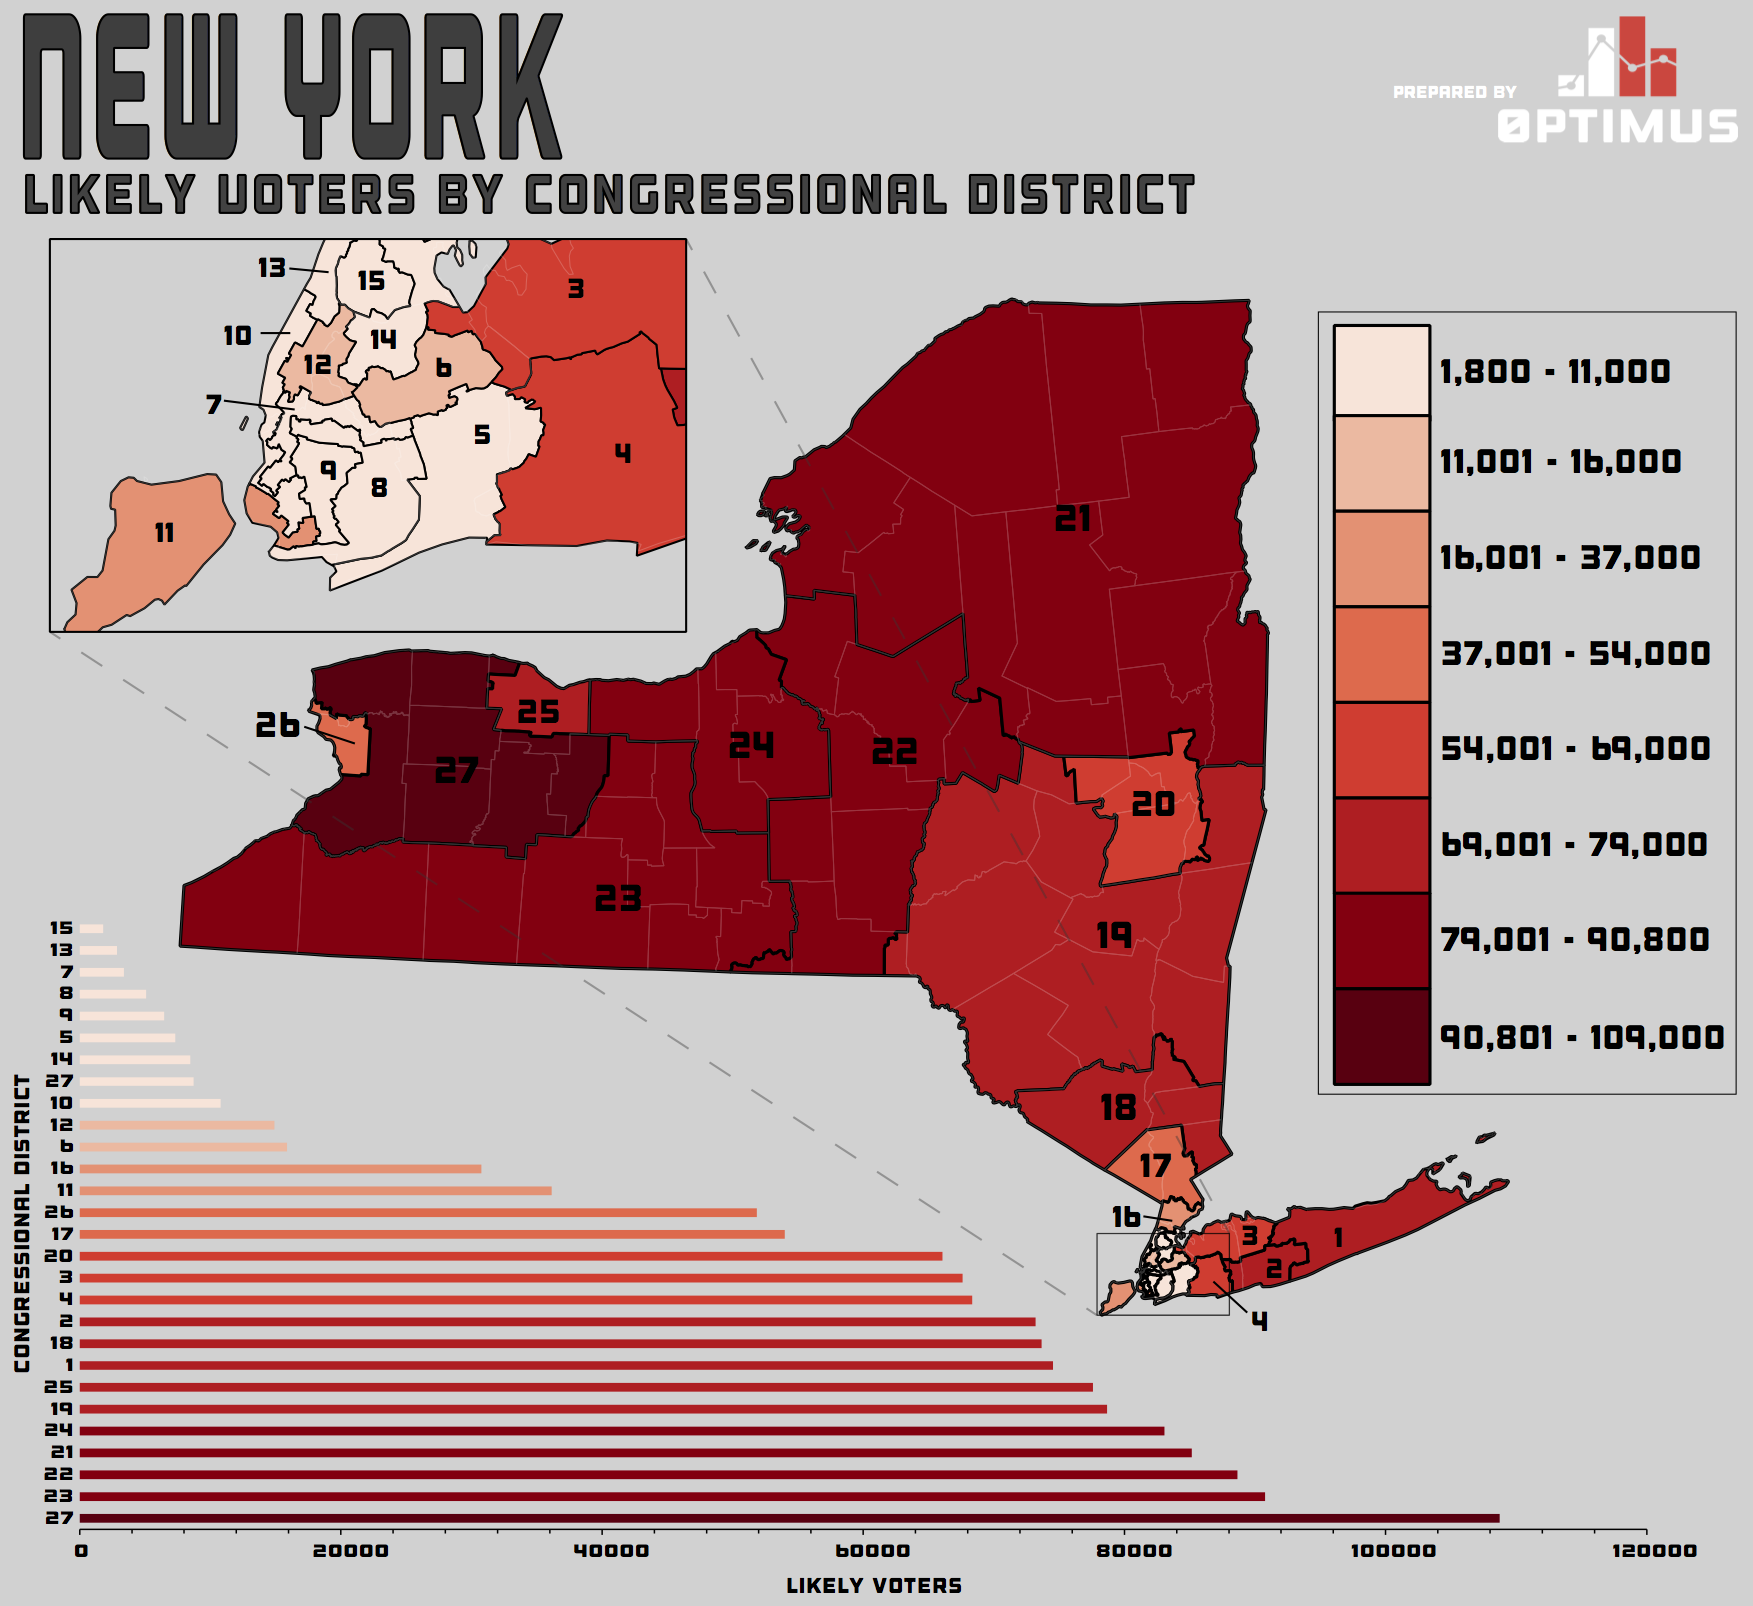
(CLICK MAP) Likely Voters by Congressional District in New York
We built a turnout model designed to estimate the probability that an individual will show up in the 2016 Presidential primary based on attendance at previous Presidential primaries. This turnout model includes previous voting history, demographic information, and commercial data available in our voter file. We used this turnout model to give each Republican a score between 0% and 100%, where 0% indicated that the voter is modeled to certainly not vote in the primary and 100% indicated that the voter is modeled to certainly vote in the 2016 primary. From this model, we selected roughly 1.3 million voters with the highest turnout score and labeled them as “likely voters.” We do not anticipate 1.3 million individuals showing up in the primary, but we believe this casts a large enough net to capture nearly all of the currently-registered Republicans who will vote in New York’s Presidential primary and is based off of doubling the 2008 Republican Presidential primary turnout in New York. (2008 is the last Presidential primary where both the Democratic and the Republican nominations were contested.)
We selected the set of likely voters who have valid landlines (roughly 940,000) as the sampling frame from which to sample people to be called. Since New York allocates some of its delegates at a Congressional district level, we pulled samples from each Congressional district. Specifically, within each Congressional district we pulled a stratified sample based on age (18-34, 35-54, or 55+) and sex (male/female) that was weighted based on the voting profile in the 2012 Republican Presidential primary in New York. Sample was pulled based on historical landline response rates toward the goal of reaching 500 survey responses at Q5 that are representative of the 2012 Republican primary electorate within each Congressional district, or 13,500 overall. It’s important to get a good look into each Congressional district as delegates are awarded at both a Congressional district level and a state level. The demographics of each CD can vary significantly, giving rise to different numbers of target voters in each CD. Note that the distribution of likely voters across the state is not uniform across all Congressional districts.
The poll was commissioned by 0ptimus. Data was gathered through interactive voice response (IVR) calls. Calls were conducted from Tuesday, April 12th through Thursday, April 24th by TNC, Inc., a third party vendor.
At a state level, each question was answered by between 10,971 and 14,201 people and the margins of error for each question falls between 0.82% and 0.93%. (The only exception is Q3 – this was offered only to respondents who were undecided on who they would support in the election. Q3 was answered by 1,546 people with a margin of error of 2.45%.)
[…] Donald Trump is poised to win New York in a landslide on Tuesday but he could leave as many as two-dozen critical delegates on the table by failing to win an outright majority in every corner of the state, according to new congressional district-level polling provided to POLITICO. […]
[…] Donald Trump is poised to win New York in a landslide on Tuesday but he could leave as many as two-dozen critical delegates on the table by failing to win an outright majority in every corner of the state, according to new congressional district-level polling provided to POLITICO. […]
[…] Donald Trump is poised to win New York in a landslide on Tuesday but he could leave as many as two-dozen critical delegates on the table by failing to win an outright majority in every corner of the state, according to new congressional district-level polling provided to POLITICO. […]
[…] survey from Optimus Consulting shows Trump leading in all 27 congressional […]
[…] survey from Optimus Consulting shows Trump leading in all 27 congressional […]
[…] 16. April 2016 / benjaminstrehl NY: GOP Primary poll: It’s important to understand the rules of delegate allocation in New York (fun, right?). In New York there are 14 delegates awarded at a statewide level, 11 of which are truly at-large and 3 that come from the RNC, but would behave as at-large delegates at the convention. 81 delegates are awarded at a congressional district level (3 from each of its 27 districts). The statewide delegates are awarded proportionally among candidates who meet the 20% vote threshold, unless a candidate receives more than 50% of the total vote, in which case that candidate would win all 11 delegates. It’s a similar story when looking at the delegates awarded on a congressional district level: the first place finisher goes home with two delegates and second place with one, unless someone (yes, Trump) hits 50%, and then is given all three! GOP: Donald Trump 49% John Kasich 24% Ted Cruz 14% http://politicalmachination.com/poll-new-york-2016-presidential-primary-2/ […]
[…] tailor-made for the outspoken politician, with its blue-collar, working-class electorate. (An Optimus Consulting survey showed Trump topping 70 percent […]
[…] tailor-made for the outspoken politician, with its blue-collar, working-class electorate. (An Optimus Consulting survey showed Trump topping 70 percent […]
[…] roughly tailor-made for a outspoken politician, with a blue-collar, working-class electorate. (An Optimus Consulting survey showed Trump autocratic 70 percent […]
[…] tailor-made for the outspoken politician, with its blue-collar, working-class electorate. (An Optimus Consulting survey showed Trump topping 70 percent […]
[…] tailor-made for the outspoken politician, with its blue-collar, working-class electorate. (An Optimus Consulting survey showed Trump topping 70 percent […]
[…] tailor-made for the outspoken politician, with its blue-collar, working-class electorate. (An Optimus Consulting survey showed Trump topping 70 percent […]
[…] outspoken politician, with its blue-collar, working-class electorate. (An Optimus Consulting survey showed Trump topping 70 percent […]
[…] for the outspoken politician, along with its blue-collar, working-class electorate. (An Optimus Consulting survey showed Trump topping 70 percent […]
[…] outspoken politician, with its blue-collar, working-class electorate. (An Optimus Consulting survey showed Trump topping 70 percent […]
[…] tailor-made for the outspoken politician, with its blue-collar, working-class electorate. (An Optimus Consulting survey showed Trump topping 70 percent […]
[…] roughly tailor-made for a outspoken politician, with a blue-collar, working-class electorate. (An Optimus Consulting survey showed Trump autocratic 70 percent […]
[…] for the outspoken politician, along with its blue-collar, working-class electorate. (An Optimus Consulting survey showed Trump topping 70 percent […]
[…] tailor-made for the outspoken politician, with its blue-collar, working-class electorate. (An Optimus Consulting survey showed Trump topping 70 percent […]
[…] tailor-made for the outspoken politician, with its blue-collar, working-class electorate. (An Optimus Consulting survey showed Trump topping 70 percent […]