Logic and conventional wisdom may have you believe that Democratic and Republican Presidential candidates should spend most of their time and energy focusing on voters who fall near the middle of the political spectrum… because Republicans can rely on support of conservatives and Democrats can rely on support of liberals.
Not this year.
EXECUTIVE SUMMARY
- Based on public polls, Hillary Clinton enjoyed a pretty sizeable ballot test lead over Donald Trump until recently, when a number of polls showed the two neck-and-neck.
- Given these recent shifts in polls, one point of interest is to examine opinions from different political ideologies and compare how these ideologies feel about the Presidential candidates.
- Looking at ballot tests and favorability numbers across the political spectrum, it is clear that Trump and Clinton are widely disliked – even among people who would traditionally support them.
- While parties usually have the most conservative and most liberal voters locked up, comparing ideology and who likely voters plan to support this November shows that up to 30% of people who identify as “very conservative” or “very liberal” won’t support the Republican and Democratic candidates, respectively.
- In addition, two in five of these “very conservative” and “very liberal” people say the Republican and Democratic candidates, respectively, were bad choices and will cost votes.
- Looking at those who identify as politically moderate or independent, Clinton appears to have a small ballot lead in Florida and Virginia, and is tied in Pennsylvania.
- At present, no candidate has rallied their base and have little hope of gaining votes from the other end of the political spectrum – uniting the base behind them is a must for victory.
PICK ME, CHOOSE ME, VOTE FOR ME
If we were to rely on the aforementioned “conventional wisdom” one would believe that Trump might count on the “very conservative” vote and most of the “somewhat conservative” vote, that Clinton might count on the “very liberal” vote and most of the “somewhat liberal” vote, and that the remaining individuals are up for grabs by Trump, Clinton, or perhaps a third party candidate. However, this election is unlike any other election.
We asked likely voters in the swing states of Florida, Pennsylvania, and Virginia a number of questions about their political views and their opinions on the upcoming Presidential election.
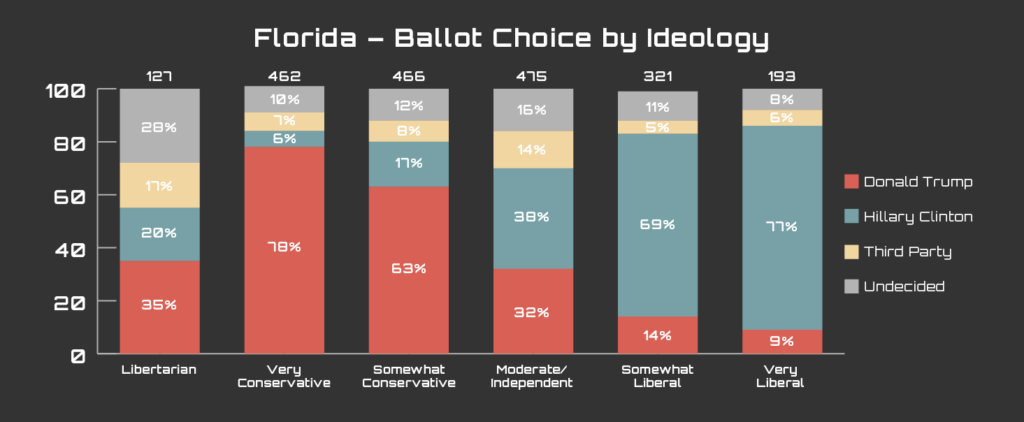
Looking into Florida, we see that, of those who identify as “very conservative,” Trump gets about 78% of their vote, with 6% going to Clinton, 7% going to a third party, and 10% undecided. While Trump’s 78% dwarfs the 22% going elsewhere, this “very conservative” stronghold *should be* the most reliable group for the Republicans in the upcoming Presidential election. (The operative term here being *should be.*) On the other end of the spectrum, we look at those who identify as “very liberal” within Florida. Similarly, Clinton pulls 77% of the “very liberal” vote with 9% going to Trump, 6% going to a third party, and 8% undecided.
Even among those identifying as “somewhat conservative” and “somewhat liberal,” the picture does not look particularly rosy for either candidate. Among those who identify as “somewhat conservative,” Trump pulls only 63% relative to Clinton’s 17%, with 8% going to a third party and 12% declaring themselves as undecided. Among those who identify as “somewhat liberal,” Clinton gets 69% compared to Trump’s 14% with 5% to a third party and 11% undecided.
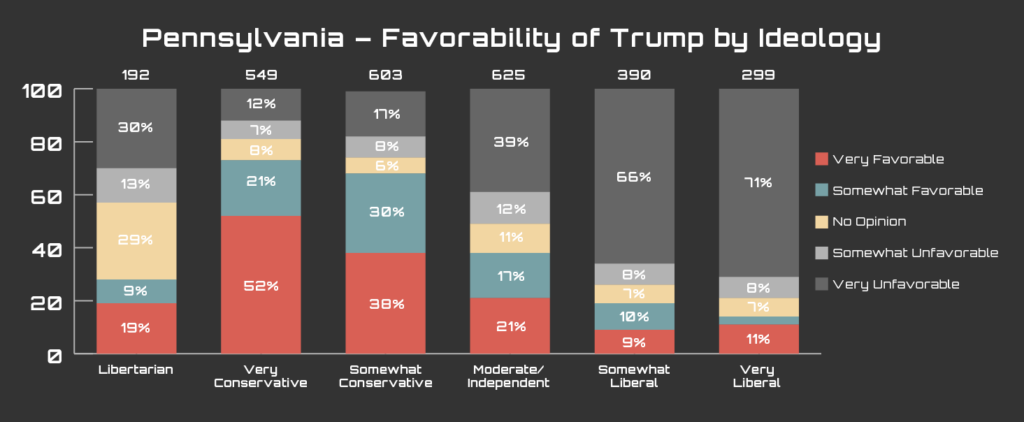
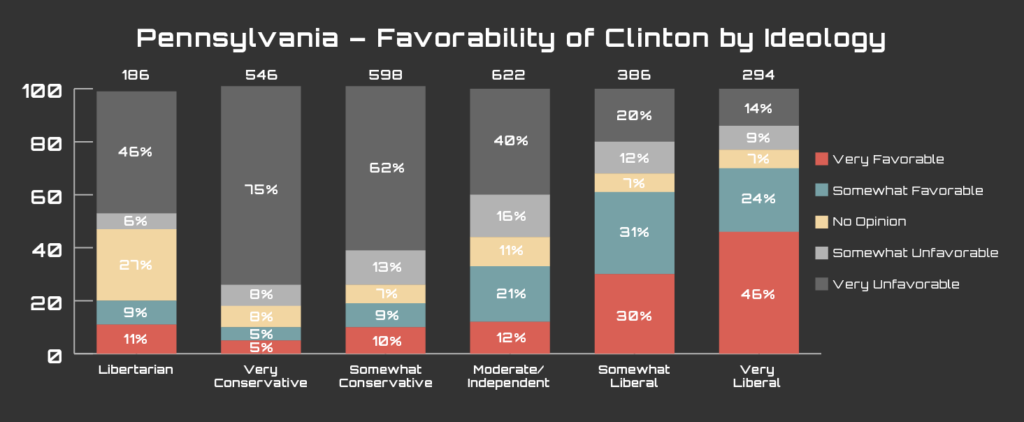
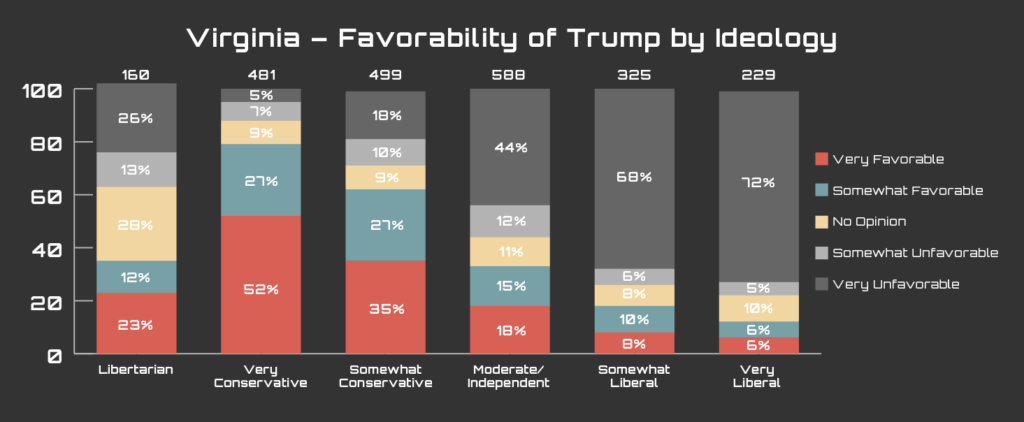
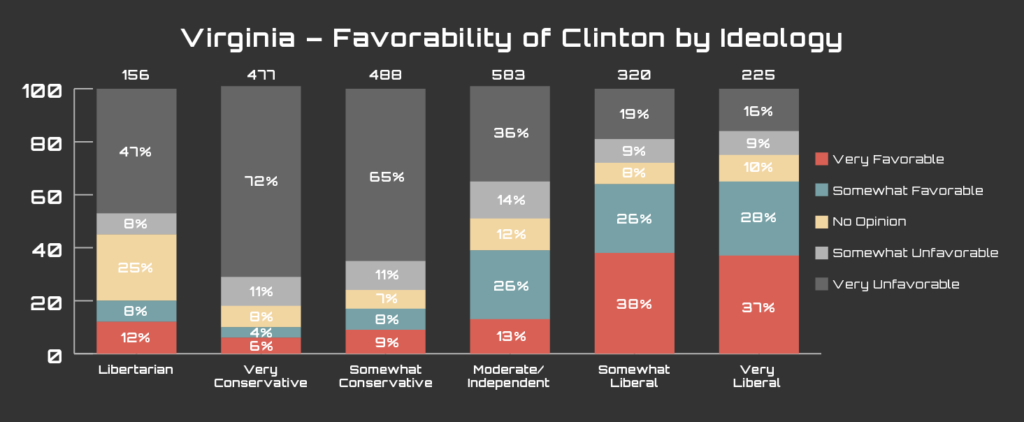
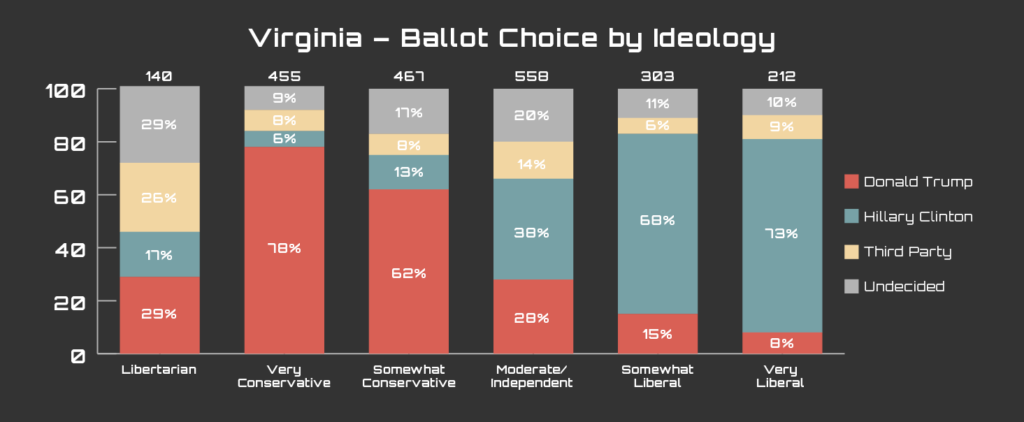
These trends appear to hold among Pennsylvania and Virginia likely voters as well. Trump pulls 77% and 78% support from “very conservative” voters in Pennsylvania and Virginia, respectively. Clinton currently sits with 69% of the “very liberal” vote in Pennsylvania and 73% of the “very liberal” vote in Virginia. The charts here illustrate that, while Trump and Clinton would hope to pull 90% or higher from these traditionally safe demographics, they’re losing about three in every ten people to “undecided,” a third party, or worse – the other team.
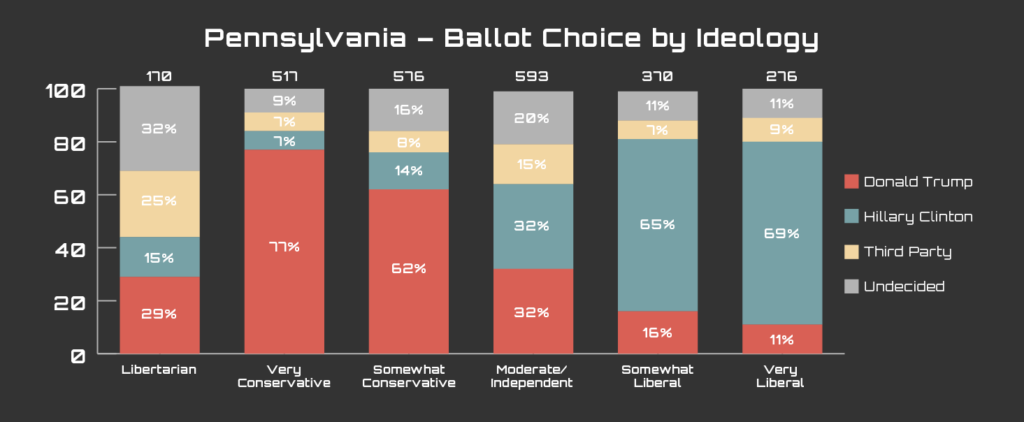
The vote among those who self-identify as moderate or independent leans slightly toward Clinton. In Florida, 38% of moderates support Clinton, 32% support Trump, and 30% plan to vote for either a third party candidate or are currently undecided. Among moderates in Pennsylvania, Clinton and Trump are tied with 32% each and 35% declare they plan to
vote third party or are currently undecided. In Virginia, Clinton sits at 38% among moderates with Trump at 28% and with 34% saying they intend to vote third party or are currently undecided.
It suffices to say that, with respect to ballot support, neither major Presidential candidate has truly consolidated their party’s traditional base. Rather than Clinton and Trump attempting to sway those people “in the middle of the aisle,” they may need to give special attention to people within their own party or expanding beyond what we’d historically think are “Democrat and Republican territory.”
Ballot support is only part of the answer here. Given that November 8 is three and a half months away, a lot can happen between now and then. Those undecideds will likely coalesce toward a particular candidate. Many people who say they will support a third party candidate today may switch to the Republican or Democratic candidate. A(nother) scandal may occur – from plagiarizing speeches to deleting emails to allegations of much worse, to think the race is set in stone would be to underestimate (or overestimate?) both Trump and Clinton.
Luckily, we can look beyond ballot test support – at favorability.
THIS FAR OUT, DOES FAVORABILITY TRUMP BALLOT SUPPORT?
Favorability, in a sense, provides a “pre-look” at ballot support. Favorability generally precedes ballot support – for example, if you aren’t set on who you will support in the upcoming election but you’re favorable toward one and unfavorable toward the other, there’s a good chance you’ll support the candidate toward whom you’re more favorable. (If you’re Republican and participated in the primary, you probably felt this as you likely settled on one candidate, then as different candidates dropped out, found someone you liked less than your original choice but could live with.) It’s imprecise because you can be favorable toward many candidates, but favorability has some value nonetheless.
Diving into this issue, it goes without saying that conservatives will in general be more favorable toward Trump than Clinton, and liberals will be more favorable toward Clinton than Trump. The two more interesting questions, especially in an election cycle with historically unlikeable candidates, is which ideological group dislikes the opposing candidate more and which side dislikes their own candidate the least.
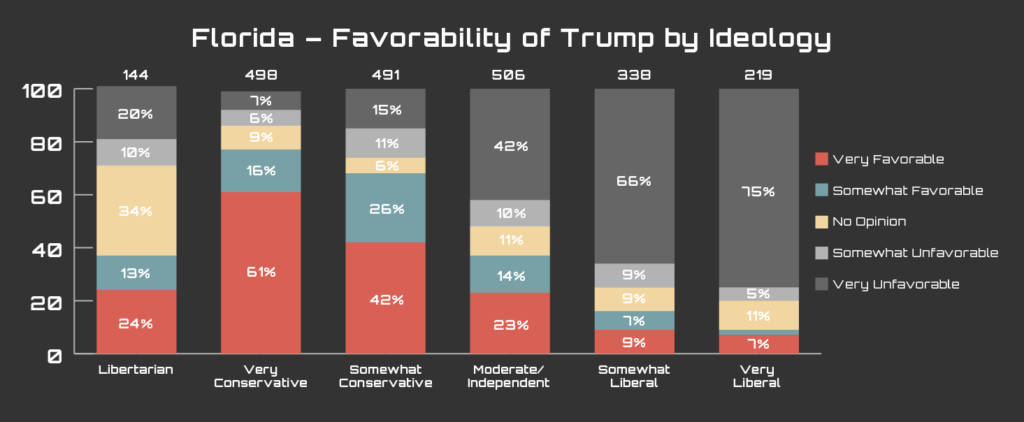
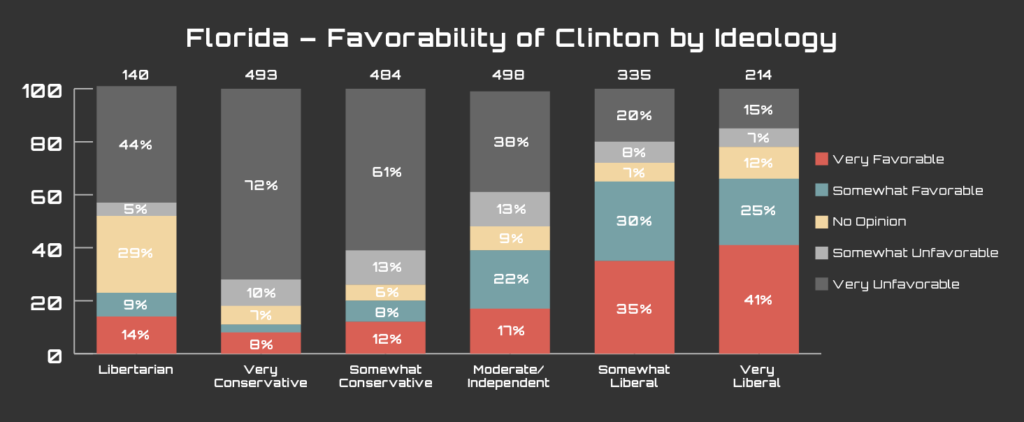
Let’s take a look at the people on the extreme ends of the spectrum – “very conservatives” and “very liberals.” Using Florida as an example, approximately 13% of “very conservative” people have an either somewhat or strongly unfavorable opinion of Trump. While being in the double digits for dislike among what *should be* (there’s that pesky “should be” again!) your base support isn’t ideal, it doesn’t seem quite as bad when you compare it to the 22% of “very liberal” voters who dislike Clinton. Fortunately for Clinton, that gap closes when looking at the less extreme ends of the ideological spectrum, where roughly a quarter of “somewhat liberal” voters dislike Clinton, and similar value of “somewhat conservative” voters dislike Trump. Unfortunately for Clinton, a similar pattern of “very conservative” voters being more loyal to Trump than “very liberal” voters are to her continues into both Virginia and Pennsylvania. It seems that Trump has captured the more conservative wing slightly more than Clinton has the liberal wing, which could account for why she’s failing to maintain her lead on Trump in the polls.
Since we’ve consistently seen the nastiness thrown from one side of the electorate to the other via the media, the next question we set out to answer is exactly how unfavorably voters of a certain ideology feel toward the “opposing” candidate. Using Florida again as an example, we can see that the level of dislike is very similar between “very conservative” and “very liberal” voters: 80% of “very conservative” voters dislike Clinton
and 82% of “very liberal” voters dislike Trump. This trend continues among “somewhat conservative” and “somewhat liberal” voters with approximately 75% of each group disliking the “opposing” candidate. We see this again when looking at Pennsylvania and Virginia, as there is no significant difference between the level of dislike for the “opposing” candidate between liberals and conservatives. This all goes to show that while both sides do appear to have a high level of dislike for the opposing team, neither candidate has much of an edge when it comes to winning over the other side of the aisle.
GOOD CHOICE, BAD CHOICE, RED CHOICE, BLUE CHOICE
Along with the traditional ballot and favorability questions, we also asked the likely voters whether or not they considered each candidate:
- A good choice who will help their party win votes,
- Neither a good choice nor a bad choice, or
- A bad choice who will cost their party votes.
When looking at this question, and what we know from past elections and party loyalty, we would expect the vast majority of likely voters identifying as liberal to respond positively to Clinton as the Democratic party’s nominee. Similarly for Trump, we would expect that most of those who identify as conservative would consider the Republican party’s nominee to be a good choice by this point in the election season. However, knowing how difficult this election season was, both on the side of Republicans and Democrats, we felt that this may not be the case. (Remember, just last week Bernie made the plunge and endorsed Clinton.)
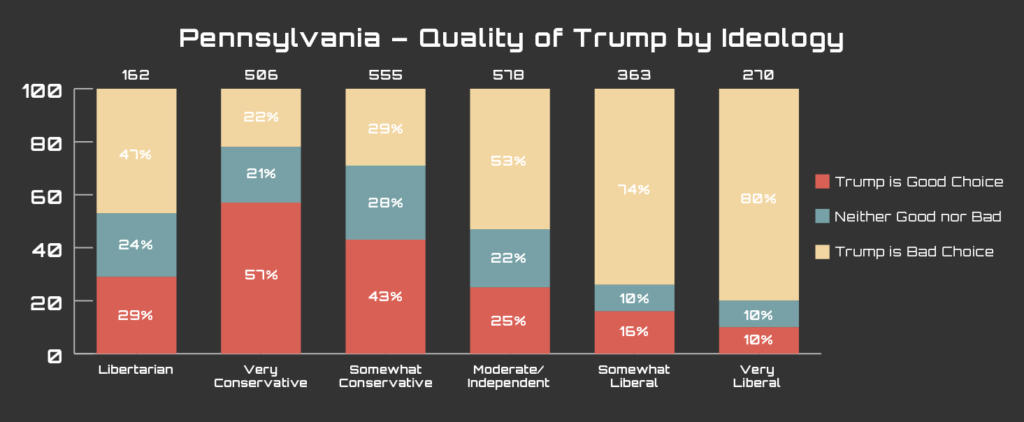
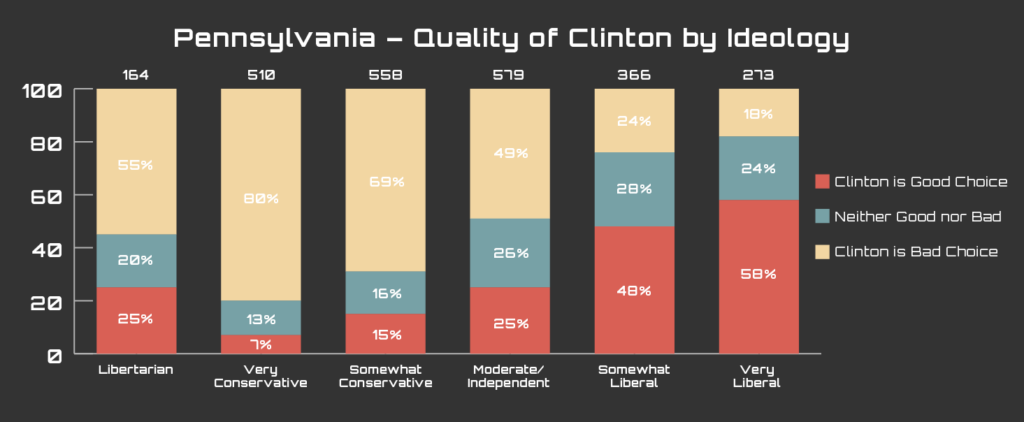
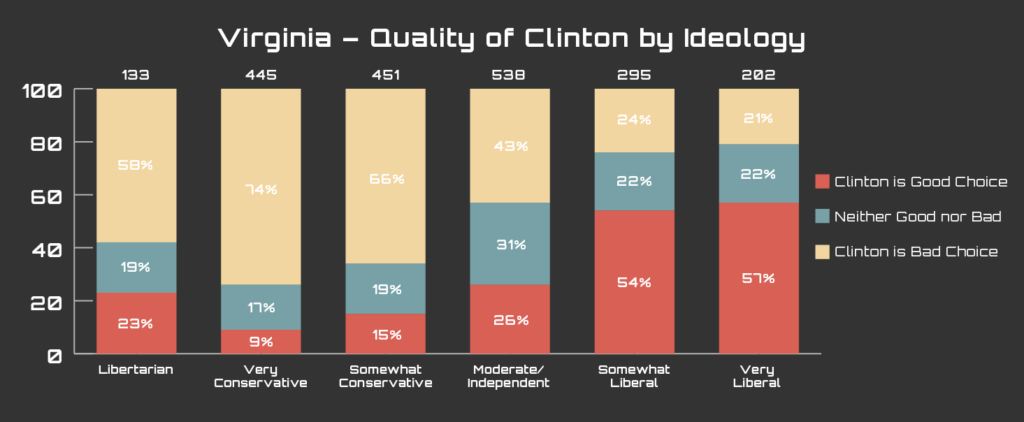
While in the three states we surveyed – Florida, Pennsylvania, and Virginia – when we asked the likely voters about whether or not Clinton was a good choice, more than half of the “very liberal” group did say yes, about 20% in each state within this group said she was a bad choice. Within the group identifying as “somewhat liberal,” the percentage of those who consider Clinton a bad choice is even larger.
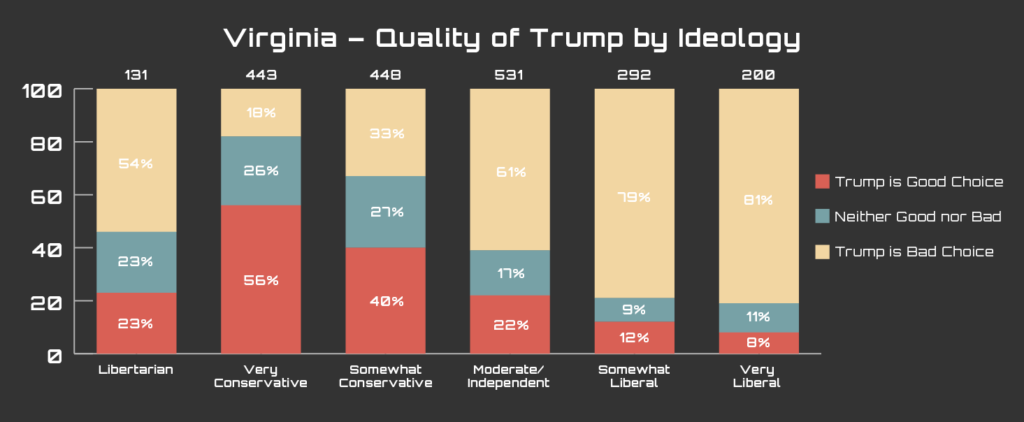
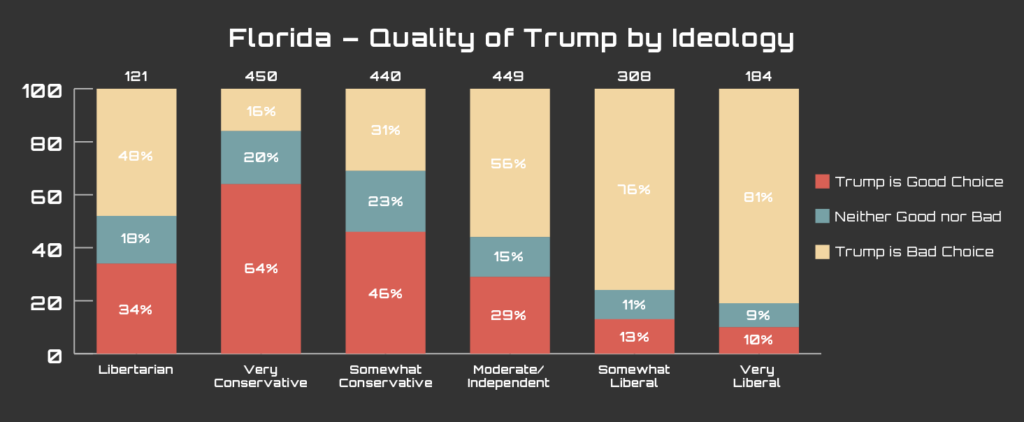
In Trump’s case, the situation of party unity is not any better. Within those three states, Trump sees either just as large or even larger numbers of both “very conservative” and “somewhat conservative” likely voters who consider him a bad choice for the party. In fact, in all three states, about 20% of “very conservatives”and about 30% of “somewhat conservatives” believe Trump is a bad choice and will cost the party votes.
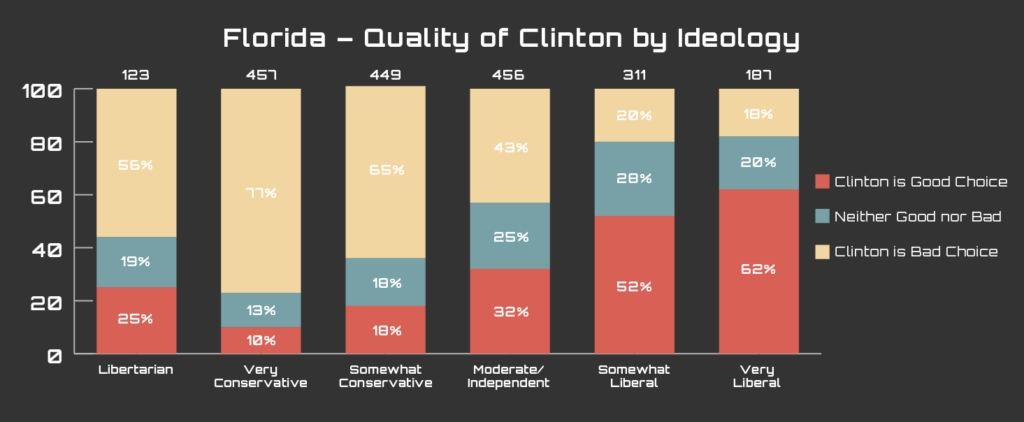
Looking at the case of Florida specifically, we see that while about 55% of “very liberal” respondents consider Clinton to be a good choice, about 21% believe she is a bad choice for the Democratic party. “Somewhat conservatives” tell a similar story – we are finding that more than two-fifths of the total pool of liberal likely voters find Clinton to be a bad choice that will lose the party votes.
The conservative likely voters in Florida similarly lack unity behind Trump as their party’s nominee. Among those who consider themselves “very conservative,” about 64% believe he is a good choice but about 16% consider him a bad choice for the Republican party. However, the numbers worsen among the “somewhat conservative” likely voters, where we found that only about 46% find Trump to be a good choice and about 31% find him to be a bad choice for the party. This shows that out of the “somewhat conservative” likely voters, less than half believe Trump was a good choice for the Republican party’s nominee, and almost one-third think he will lose the Republican party votes as a whole.
These trends continued into the other states surveyed. Among all conservative likely voters in these three states, just around half consider the Trump to be a good Republican party nominee for president and nearly one-third believe he is not only a bad choice, but will lose the party votes in November. For liberal likely voters within these three states, consistently about one-fifth consider Clinton a bad choice. Clearly, both parties are not completely satisfied with their presidential options.
It is not that in each presidential election we expect every member of each party to completely support their party’s choice for nominee, nor do we expect that “liberal” and “conservative” will align exactly with “Democratic” and “Republican.” We can be sure that this is not the first election that Republicans and Democrats are not completely satisfied with their options for nominees. Traditionally, however, at this point in the election season, with both parties having chosen their nominees, one would expect more party unity behind each candidate then what currently shows. While we wouldn’t expect 100% of all Republicans to believe in their party’s choice, we also wouldn’t expect almost 30% to consider their choice a bad one.
What we need to ask here, then, is why do both candidates see such dissonance among their respective parties? Why, about three months before it’s time to vote, do the parties appear so disappointed with their choices?
Considering the timing of these survey results (7/14-7/17), a few major events recently occurred in the election world: Senator Bernie Sanders withdrew from the race and endorsed Clinton while Trump announced Governor Mike Pence as his running mate. Sanders’ recent withdrawal might result in some of the “very liberal” and “somewhat liberal” cohort not supporting Clinton at this point. Trump’s selection of Pence likely boosted his support among social conservatives for the time being, given Pence’s record on social issues.
If these hypotheses prove true, perhaps Clinton will see her support among liberals rise over the coming months while Trump might be enjoying a temporary bump from the recent announcement of Pence. These rely on speculation – not numbers – but will be fascinating to watch over the coming weeks and months.
If we learn anything from these numbers, it’s that both candidates have significant opposition within their bases but also do not have a strong shot with members of the other party… and if this election has taught us anything, it’s that literally anything can happen over the next three and a half months.
APPENDIX
Here you can find the remaining graphs for Pennsylvania and Virginia.