
This week Chuck Todd on Meet the Press featured 0ptimus analysis on its weekly political news show.
Read below for full report.
Executive Summary:
- Donald Trump suggests that he is a boon for the Republican party: Citing the massive increases in Republican presidential primary turnout, he says he is bringing millions of new people in the party
- A multi-state analysis performed by 0ptimus, a Republican analytics firm, suggests this is not the case.
- Example #1: Battleground Virginia: 81.4% of the 2016 primary electorate is indeed new to the primaries, but:
- 72.1% are voters who have a history of showing up in general elections
- Modeling reveals these voters to already be Republicans (e.g. these are not cross-over Democrats or independents).
- 3.6% are voters who were too young to have established prior voting history
- Only 5.7% are “new” voters in the sense that we don’t see prior general- or primary-election vote history.
- Note: this 5.7% represents about 58k votes, well short of the 149k gap Romney would have needed to win the state in 2012.
- In short, there was indeed high turnout in Virginia republican presidential primary, but the voters who formed this turnout are already typical general election voters and already typical Republican supporters. The GOP should not expect a boost from a wave of new voters, or from cross-over voters, based on what we have seen in the primary.
- 72.1% are voters who have a history of showing up in general elections
- Example #1: Battleground Virginia: 81.4% of the 2016 primary electorate is indeed new to the primaries, but:
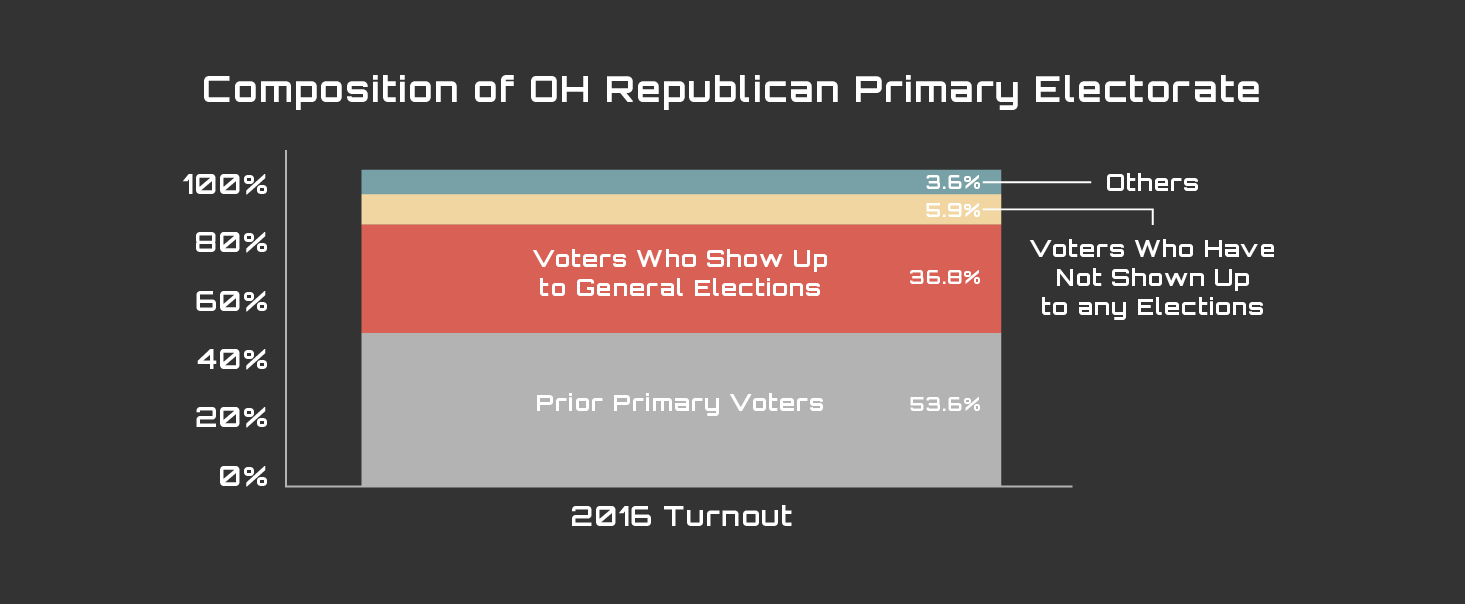
- Example #2: Battleground Ohio: 46.4% of the primary electorate is indeed new to the primaries, but:
- 36.8% are voters who have a history of showing up to general elections
- Modeling reveals these voters to be Republicans (e.g. these are not cross-over Democrats or independents)
- 3.6% are voters who were too young to show up in prior primaries
- Only 5.9% are “new” voters in the sense that we don’t see recent general or primary election vote history
- Note: this 5.9% represents 118k voters, well short of the 166k gap Romney would have needed to make up to win the state in 2012.
- In short, we did see higher turnout in the Ohio republican presidential primary. But, similar to Virginia, the voters who drove this increase in turnout were largely general election voters who model to be Republican supporters. So again, the GOP should not expect a boost from either a wave of new voters, or from voters crossing over to support the Republicans.
- 36.8% are voters who have a history of showing up to general elections
Sources for these conclusions: high-sample modeling based on live-interviews on cell phone and landline (E.G. ~4k interviews in Virginia, ~4k interviews in Ohio).
Analysis and modeling produced by Brian Stobie and Haley Sorensen of 0ptimus Consulting
The claim we sought to test:
Donald Trump has stated on numerous occasions that he is bringing new members into the Republican party. The evidence for this claim that he points to is high levels of turnout for primaries, recently saying, “the Republican Party has a great chance to embrace millions of people that it’s never known before. They’re coming by the millions.”
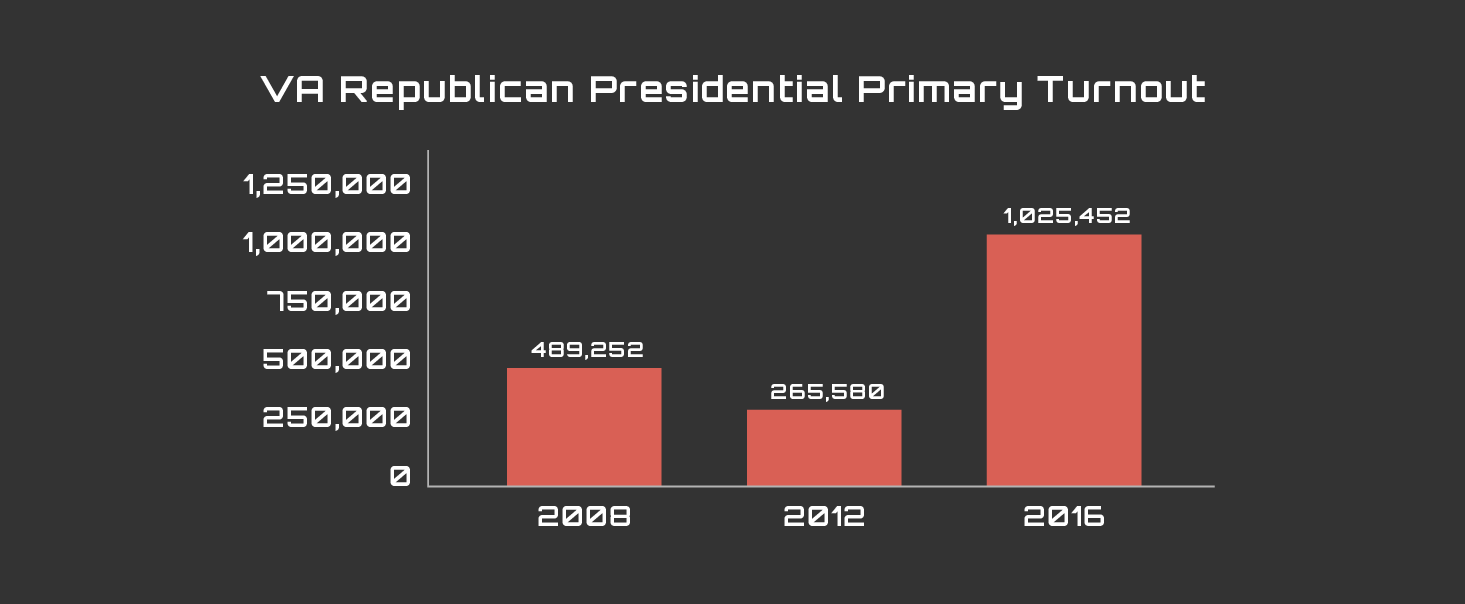
A surface examination of his argument might lead you to believe he is right. Consider the case of the battleground state of Virginia. In the Republican presidential primaries, turnout was way up (see graph to right). So his argument holds so far; lots more people have turned out to the Republican primary. The question is, can Republicans count on that primary turnout increase to equate to large swaths of new voters or party-crossing voters turning out for the general election in November, delivering them victory?
Digging deeper: Virginia Republican Primary Electorate Composition
To answer that question, we dug into who the people were that comprised the massive turnout we saw in Virginia. In the graph to the right, we breakdown the 2016 Republican primary electorate in terms of its voting history prior to this election. We find that some 18.6% of the 2016 electorate had shown up to Republican primaries in the past. We find that 72.1% of the 2016 electorate had not shown up to Republican primary elections before, but had shown up to general elections in the recent past. And 5.7% of 2016 electorate were voters who had not shown up in past primary or general elections, but who have been on the voter file and eligible to participate in recent elections.
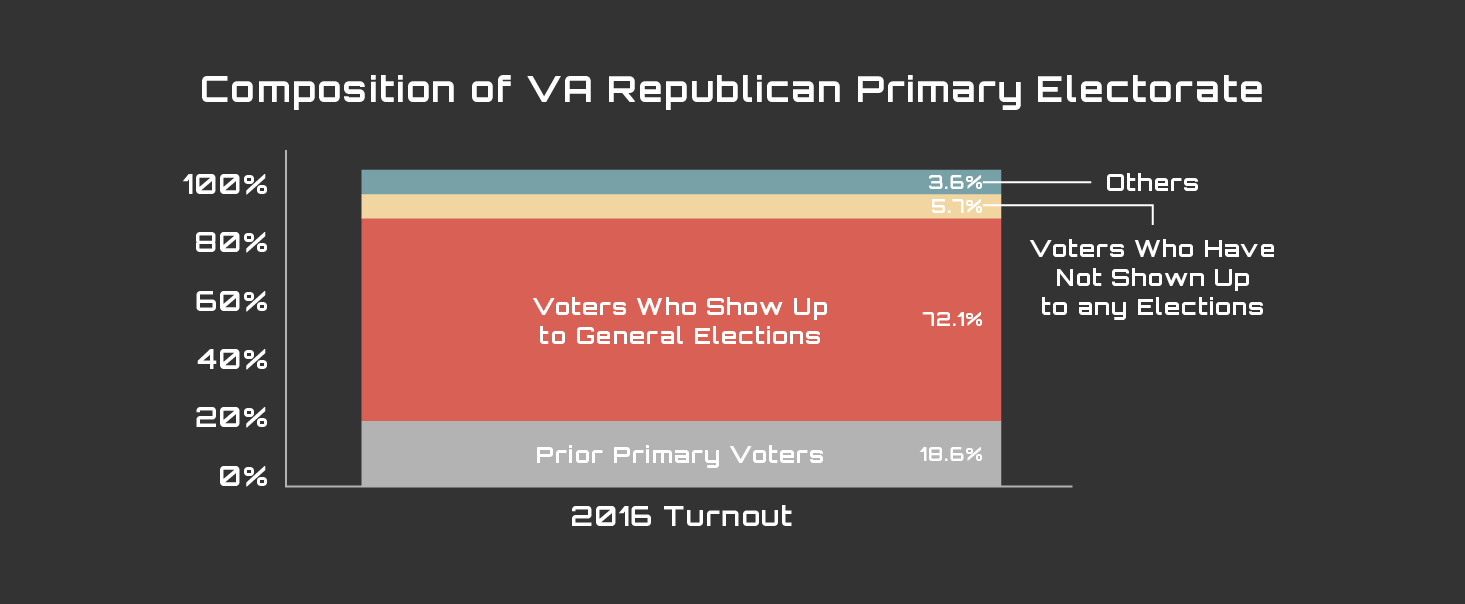
The remainder of the 2016 voters, comprising 3.6% of the electorate, are a compilation of numerous other categories of voters. Within this group of “Others”, the largest group (98%+) are young voters or recent movers who have not had the opportunity to generate past voting history in Virginia.
When we step back and look at this, it looks like the record primary turnout we saw in this election wasn’t new voters coming out to join the Republican party, it looks like they are simply general election voters who don’t typically show up in primaries. So it looks like there is not a large swath of new voters who flooded the elections in the primaries that are going to flood the polls in the general election: they already show up to general elections.
Now to play devil’s advocate, what about the 5.7% of the primary electorate which has not shown up to elections in the past; that’s still a lot of voters. Couldn’t that swing the election in Virginia? In short, no. In 2012, Gov. Mitt Romney lost to President Barack Obama in Virginia by ~149,000 votes. So even if Trump wins every vote Mitt Romney did, and we add in these 58,000 voters who look like truly new voters, the Democrats still win the election if they can reproduce their turnout levels from 2012.
If these are not “new” voters, maybe they are still “new” voters for the Republican party?
We have proven that by and large the primary voters aren’t “new voters” in the sense that we have seen these voters show up in general elections. But they could still be cross-over voters– those who would normally be independents and Democrats showing up to the Republican primary. To test that theory, we take advantage of what we know about these voters from high-sample opinion modeling.
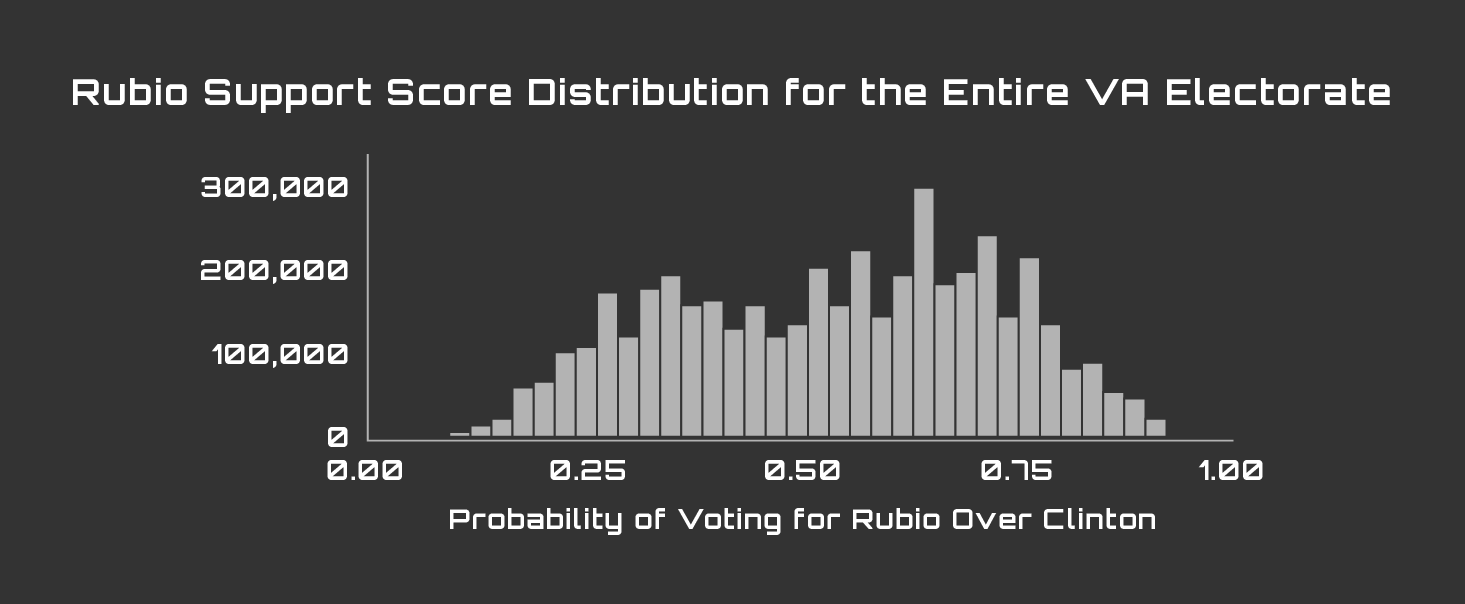
In early March, ahead of the Republican primaries, we conducted 3,979 live interviews — 50% on cell phones and 50% on landlines in Virginia — against the general election electorate in that state. So to be clear, we were not calling into the Republican primary electorate, but rather we were calling into the whole registered voter file to understand opinion between various candidate matchups. For example, we asked voters to tell us who they would support if the race came down to Sen. Marco Rubio and Secretary Hillary Clinton. We then used these 3,979 responses to construct a model for the Virginia voters. This model was used to generate the likelihood that each voter would support Marco in that matchup. So someone who scored a .25 had a 25% chance of supporting Marco. Someone who scored a .8 had a 80% chance of supporting Marco. We then mapped the distribution of all voters in Virginia by their likelihood to vote for Marco Rubio (see Graph C). A quick examination shows this is modeled to be a pretty competitive election.
Using these scores, when we look at just the 72% of the 2016 Republican primary electorate that were first-time primary voters but known general-election voters, a different distribution appears (see right).
The distribution is heavily weighted to the right. In other words, the vast majority of the voters who flooded into the Virginia Republican primary were not only voters who already show up to general elections, but voters who are likely to support Republican candidates when they do show up.
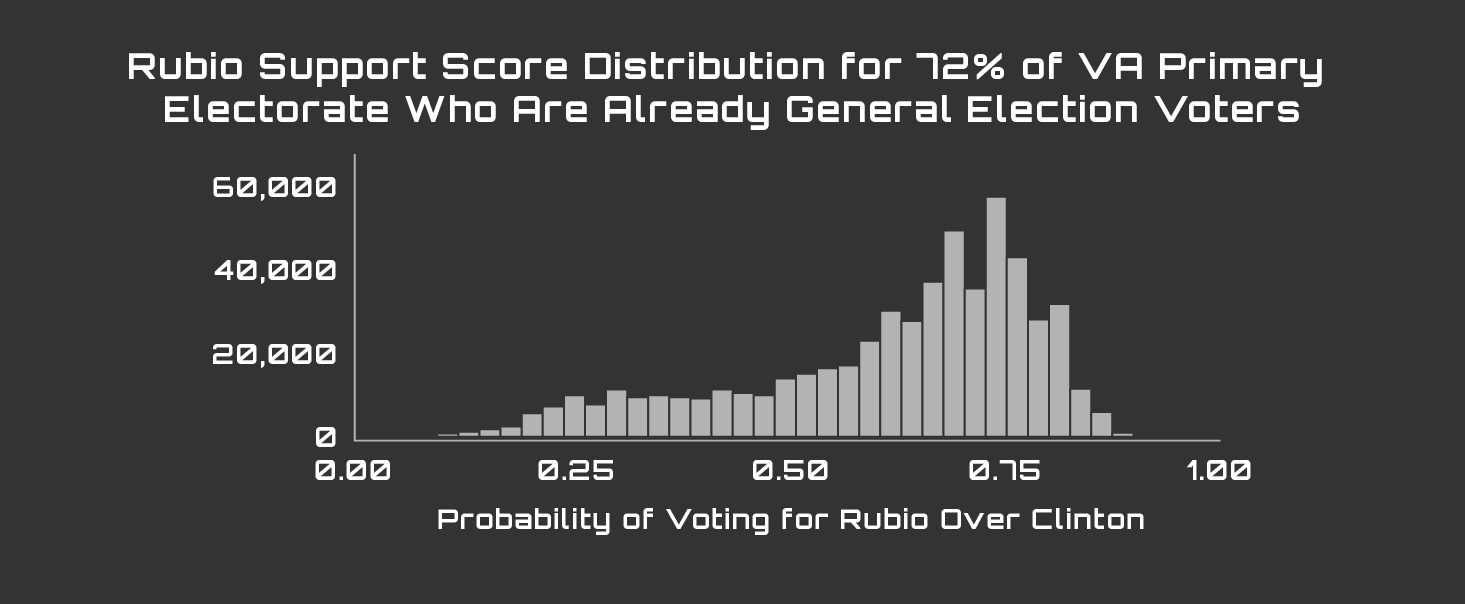
But let’s play devil’s advocate again. It looks like ¼ of the volume of these voters in Graph D are actually rating as likely Democrats (0 to .4). One quarter of this group is 180,000 voters that look like they are voting for Trump, and that would flip an election that otherwise looked like Romney/Obama ’08. Remember, however, that these scores are a model for likelihood to support Marco against Clinton, in terms of the whole electorate. So for example, in graph C, if we look at the bar directly over the tick “.25”, we would say there are 100,000 members of that bar. And we would say that of the 100,000 members that make up that bar, there are 25,000 Republican votes, and 75,000 Democratic votes. If we look at the same tick position in graph D, we see ~10,000 voters. In other words, we are likely seeing self-selection of those voters who are in fact Republican voters, members of the 25,000 group, showing up to the primaries. The big signal that we should observe in graph D is the lopsided rightward tilt of its distribution– not the fact that some of its members belonged to ratings groups with a low probability of being Republican, as this is somewhat of a predictable outcome.
So to sum up our deep-dive into Virginia, we conclude that the increase in presidential primary turnout should give little comfort to the GOP as it looks ahead to November’s general election. The voters that drove the high turnout already show indicators of voting in general elections, and it appears these voters are already pretty Republican-leaning. In other words, if all the voters that showed up to this primary showed up again for the general, we wouldn’t expect the Virginia race’s fundamentals to shift much at all: by in large, these same voters showed up for Romney too.
Maybe this effect was limited to Virginia? What about other states?
Let’s look at another key swing state, Ohio, and see if the story changes.
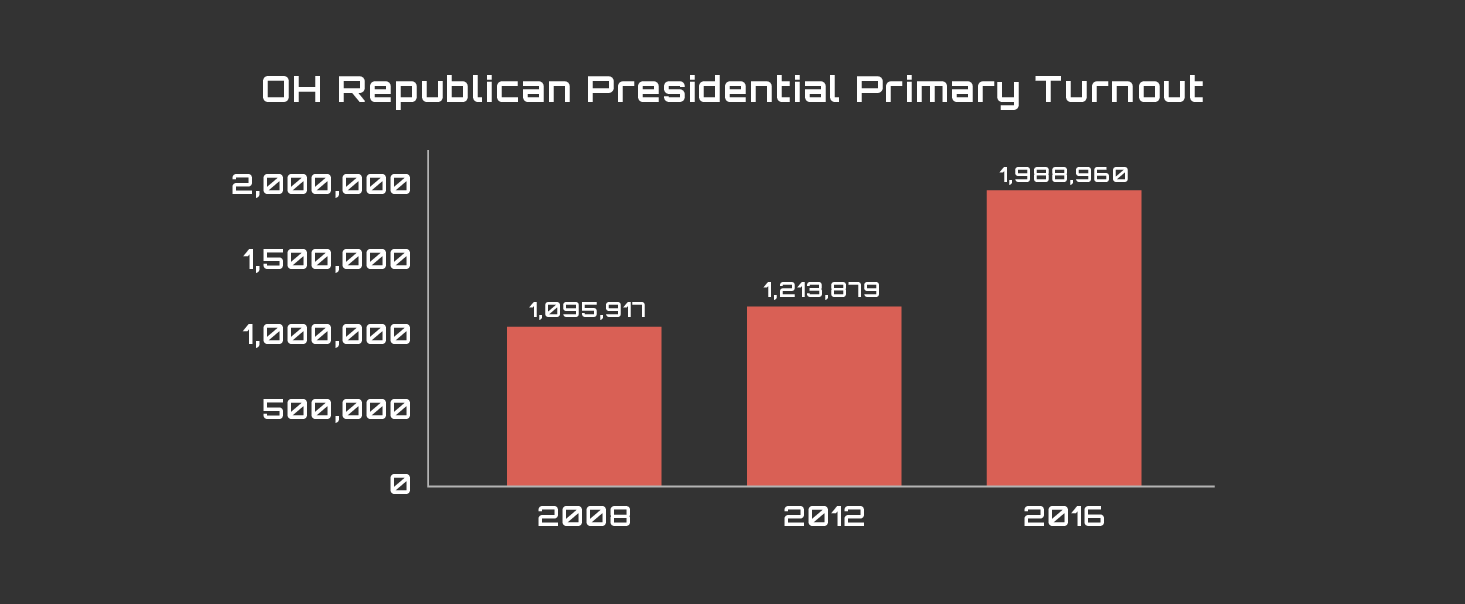
If we start by looking at overall turnout, we see that as in Virginia, Ohio turnout is high when compared with recent like-races. We note, however, that where Virginia experienced 2X-4x historical turnout levels, Ohio’s turnout increased by less (less than 2X).
When we look at who made up the 2016 Republican primary electorate in Ohio, we note that the majority of primary voters (53.6%) are prior primary voters. 36.8% are not prior primary voters, but are prior general voters. Only 5.9% are truly “new voters” in terms of our ability to see them voting in either general or primary elections. 5.9% of voters are too young or don’t have a long enough vote history for us to apply this analysis to them.
Again, let us consider the potential impact of the 5.9% who are truly new voters in the general election. 5.9% of 1.98M is ~118k voters. Mitt Romney lost Ohio to Obama by 166k votes. So even if Trump wins every vote Romney did, and we add in these new voters we saw show up in the primary, the Democrats still win the election.
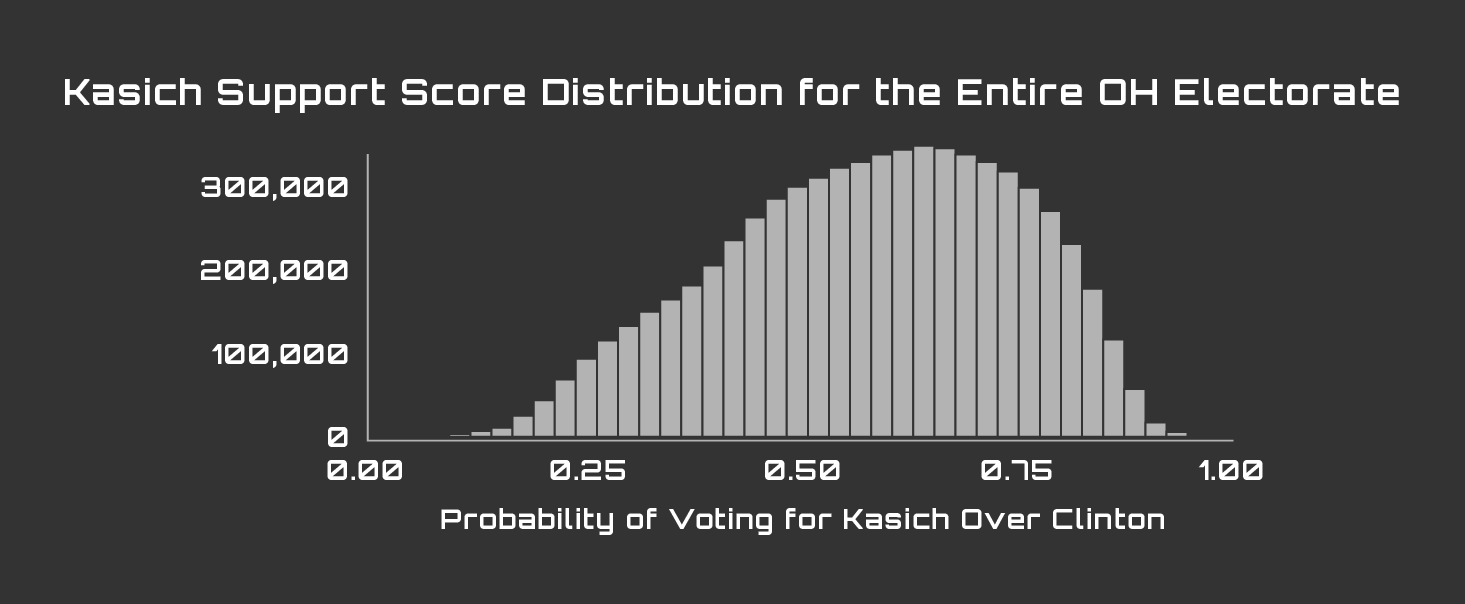
But what about the 36.8% of voters who are general election voters but who showed up in this primary: Do they look like cross-over voters? Let’s first look at the preferences of the state’s general electorate. Again, in early March, before the primary in Ohio, we conducted a high-sample modeling round of surveys. The survey reached 3,906 participants using live interviews and had a 50-50 cell/land split. One of the questions we asked was a head-to-head matchup between Hillary Clinton and Gov. John Kasich. The distribution of support scores for John Kasich resulting from that question’s modeling is shown in graph G. We note that the state starts off with a lean-right skew (pro-Kasich), which make sense given his recent statewide election results and in-state popularity.
When we look at the scores for just the 36.8% of 2016 primary voters who have not shown up to primaries in the past, but do show up in general elections, we see a curve that leans even further right than the state at large (see graph H). In other words, these voters look pretty Republican already and we don’t see evidence that this represents mass Democratic defections.
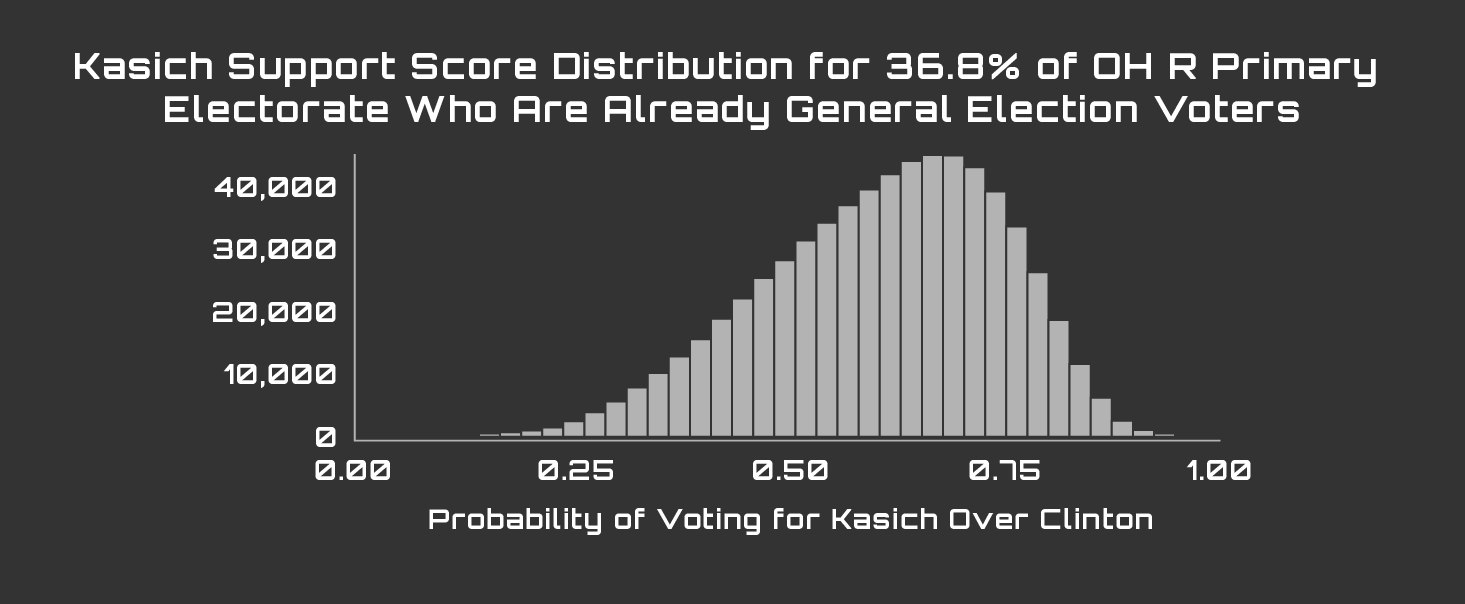
So to sum up Ohio, we would say that the overall share of new primary voters (but observed general elections voters) was 36.8% of the 2016 Republican primary electorate. These voters look pretty Republican (e.g. they don’t look like Democratic cross-over voters). Only 5.9% of the 2016 Republican primary electorate were truly new voters, and represent ~118k voters. But if we add these voters onto the general election total for Romney, Obama would still have won Ohio.
Can we say anything about other states?
If we look at a sampling of states from which we have updated voter files that show 2016 primary activity, we see that some states do experience higher levels of what appears to be truly “new voter” turnout. A sampling of examples is provided below in Figure I.
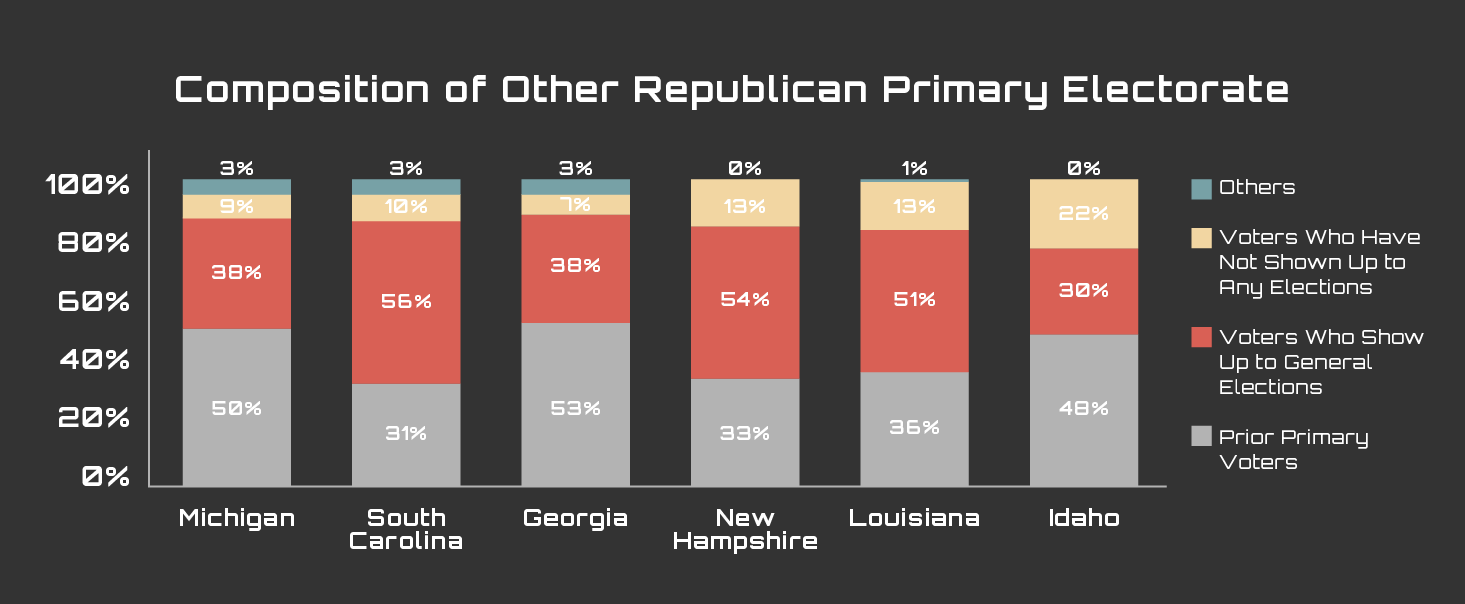
The problem is that many of these states are not really swing states where Trump or the GOP need a lot of new voters. For example, Idaho had a lot of new voters, but if the GOP really needs to count on new voters to win Idaho, it has bigger problems.
Let’s consider the two states which are more akin to swing states.
New Hampshire is a true swing state, and 283k voters showed up for its Republican primary. 13 percent of these voters appear to be truly new voters, in that we don’t see them showing up to recent past general or primary elections. This group was about 37k voters. Romney lost the state to Obama in 2012 by 39k votes. So in this case, we concede if all these new voters were Trump voters and if they follow through to vote for him in November, and if Trump simultaneously wins all Romney voters in state, and if Democrats have similar performance to their 2012 effort, then these voters might get Trump close to winning New Hampshire.
Let’s consider Michigan, as this is one of the states that Trump might say he puts “on-the-map” in this election. New voters in that primary looked to be about 9% of the total turnout of 1.32 million, or 119k voters. The problem is that Romney lost Michigan to Obama by 450k votes. So these voters showing up and adding strength to the GOP position will not be enough to flip the state for Trump.
Conclusion:
- This analysis evaluates the claims made by Trump and his team/allies that Trump is bringing in millions of new voters to the GOP who don’t typically vote, and bringing in millions of cross-over voters to the GOP. As evidence of this claim, they cite the primary election contests where turnout has increased drastically compared to past elections
- We conclude that for the most part, increases in Republican primary turnout were driven by Republicans who don’t typically vote in primaries, not by truly “new voters”
- While each state’s Republican presidential primary electorate does have some small component of truly new votes, that components tends to be small and inconsequential to recent Republican/Democrat general election margins
- All this is to say that the evidence says that the GOP is not really seeing an influx of new voters, or a massive influx of cross-over voters, but rather an engaged party particularly interested in this election cycle.
[…] battleground states like Virginia and Ohio, also confirm that Trump’s claim is more myth than reality: one GOP-leaning organization concluded that “there is not a large swath of new […]
[…] research firm Optimus published a study about the 2016 primary turnout in several battleground states in May, analyzing the claim that high […]
[…] while building hype about Republican turn out. Turns out that Trump is not expanding the GOP and is not bringing in a wave of new voters. In fact, turn out this year is not a record […]
[…] while building hype about Republican turn out. Turns out that Trump is not expanding the GOP and is not bringing in a wave of new voters. In fact, turn out this year is not a record […]