
From 3.22.16 – 3.24.16 an IVR based poll was conducted in Wisconsin of likely Republican presidential primary voters. The poll was has an N = 6,182(!), weighted, stratified listed sample at the statewide level and each individual congressional district. Yes, each congressional district. Delegate math junkies here is your fix.
Results of the Wisconsin Survey can be found at http://bit.ly/WIpoll032216-032416
Full deep dive analysis of results can be found in these follow-up pieces:
For Someone Who Offends Everyone, What Groups *Do* Like Trump?
Do Trump Supporters Really Think Mexico Will Pay For The Wall?
A Woman’s Right to Choose: Aborting Trump’s Campaign
In the interest of transparency, the following paragraphs will provide the standard information made available by most reputable polls as well as explain the thought process behind our methodology. We hope this serves to raise the bar on what should be disclosed on polling methodology.
SAMPLING METHODOLOGY & UNIVERSE DEFINITION
Since we are interested in assessing attitudes of potential voters, our population is all those who will vote in Wisconsin’s 2016 Republican Presidential primary election. Considering the obvious issues of not knowing who will participate in the upcoming Republican primary, we start with a sampling frame of all registered voters based on in-house voter files maintained by 0ptimus. This sampling frame is deemed to be too large because historically the proportion of registered voters who vote in the Presidential primary is significantly smaller. For example, of the 1,200,000 currently-registered Wisconsin Republicans in our voter file, roughly 520,000 (43.5%) voted in the 2012 Wisconsin Republican Presidential primary.
We built a turnout model designed to estimate the probability that an individual will show up in the 2016 Presidential primary based on attendance at previous Presidential primaries. This turnout model includes previous voting history, demographic information, and commercial data available in our voter file. We used this turnout model to give each Republican a score between 0% and 100%, where 0% indicated that the voter is modeled to certainly not vote in the primary and 100% indicated that the voter is modeled to certainly vote in the 2016 primary. From this model, we selected 750,000 voters with the highest turnout score and labeled them as “likely voters.” We do not anticipate 750,000 individuals showing up in the primary, but we believe this casts a large enough net to capture nearly all of the currently-registered Republicans who will vote in Wisconsin’s Presidential primary and is based off how many individuals voted in either the 2008 or the 2012 Republican Presidential primary in Wisconsin.
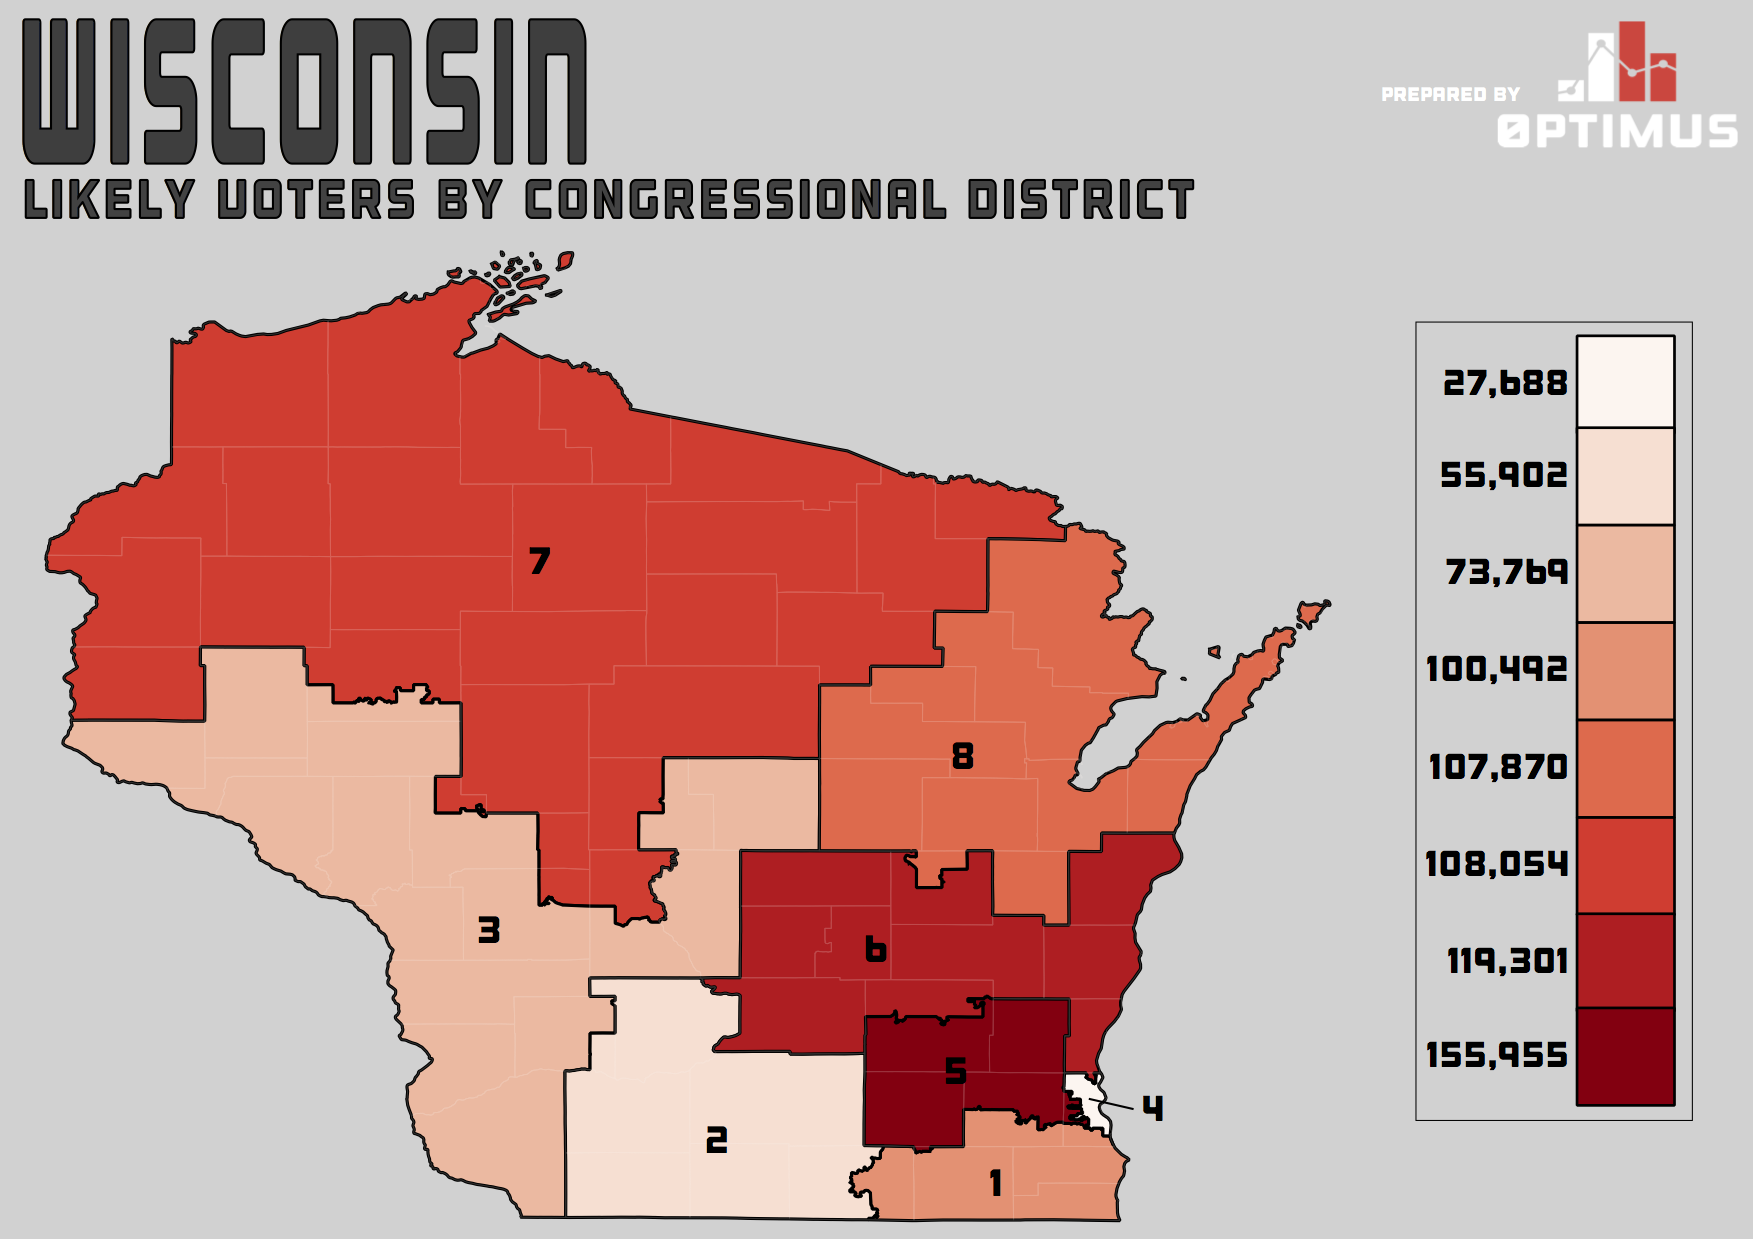
(CLICK MAP) Likely Voters by Congressional District in Wisconsin
We selected the set of likely voters who have valid landlines (roughly 590,000) as the sampling frame from which to sample people to be called. Since Wisconsin allocates some of its delegates at a Congressional district level, we pulled samples from each Congressional district. Specifically, within each Congressional district we pulled a stratified sample based on age (18-34, 35-54, or 55+) and sex (male/female) that was weighted based on the voting profile in the 2012 Republican Presidential primary in Wisconsin. Sample was pulled based on historical landline response rates toward the goal of reaching 500 survey responses at Q5 that are representative of the 2012 Republican primary electorate within each Congressional district, or 4,000 overall. It’s important to get a good look into each Congressional district as delegates are awarded at both a Congressional district level and a state level. The demographics of each CD can vary significantly, giving rise to different numbers of target voters in each CD. Note that the distribution of likely voters across the state is not uniform across all Congressional districts.
The poll was commissioned by 0ptimus. Data was gathered through interactive voice response (IVR) calls. Calls were conducted from Tuesday, March 22nd through Thursday, March 24th by TNC, Inc., a third party vendor.
At a state level, each question was answered by between 4,464 and 6,182 people and the margins of error for each question falls between 1.14% and 1.45%. (The only exception is Q3 – this was offered only to respondents who were undecided on who they would support in the election. Q3 was answered by 935 people with a margin of error of 3.10%.)
[…] Optimus poll was conducted March 22-24. It has a margin of error of 1.1 percentage […]
[…] showing Cruz leading by five percentage points and one point, in a poll released on March 25 by the Optimus research firm showed Trump pulling ahead by two percentage […]
[…] is a contentious battleground state between Trump, Cruz, and Kasich, with recent polls showing a dead heat between the three—31 percent for Trump, 29 percent for Kasich, and 27 percent for Cruz. Other […]
[…] Optimus poll was conducted March 22-24. It has a margin of error of 1.1 percentage […]
[…] Optimus poll was conducted March 22-24. It has a margin of error of 1.1 percentage […]
[…] Optimus poll was conducted March 22-24. It has a margin of error of 1.1 percentage […]
[…] Optimus poll was conducted March 22-24. It has a margin of error of 1.1 percentage […]
[…] Optimus poll was conducted March 22-24. It has a margin of error of 1.1 percentage […]